The DeltaT50- Method |
|---|
By Christina Abrahamsson PhD, Corina Dota MD, Bo Skallefell BSc, Leif Carlsson PhD, Nils Edvardsson MD PhD, Göran Duker PhD, AstraZeneca R&D, Göteborg, Sweden.
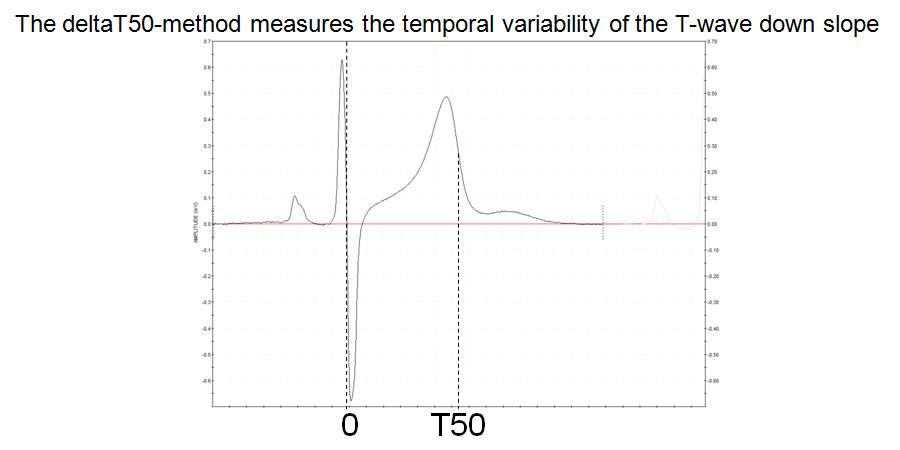
Increased beat-to-beat variability in cardiac repolarization time is a tentative risk marker of drug-induced torsades de pointes. Evaluation of its value as a risk marker requires automatic measurements of the repolarization time on single beats, which is truly a challenge, especially when the ECG signal is noisy or of low amplitude. The deltaT50 method measures the beat-to-beat variability of the “T50-interval”, the time from the intersection of the RS line and the isoelectric line to 50% of the T wave downslope (Fig. 1). Noise reduction of the T wave downslope is achieved by using 21 points smoothing (Fig 2). The deltaT50 algorithm is incorporated in a special version of EClysis used for research properties. It enables automatic, operator-independent measurements on ECG signals with a signal-to-noise ratio (SNR) of at least 10 if beats following changes in the RR interval exceeding 150 ms are excluded and if 9 beat pairs are available for analysis.

FIGURE 1:
Figure 1 The deltaT50 method measures the beat-to-beat change in the “T50 interval”, i.e. from the intercept between the RS and isoelectric lines to 50% of the T wave downslope
The reason for choosing the start of the T50 interval at the intersection of the RS and isoelectric lines was that this point is easier to determine automatically than the start of the QRS complex. The idea of measuring the interval, not to the end of the T wave (which is also very difficult to define), but to 50% of the T wave downslope, arose from what can be seen on superimposed, consecutive ECG complexes, namely that the whole T wave downslope appears to shift in parallel when the QT interval changes beat by beat. This was also confirmed from measurements of the variability at 20 and 80% of the T wave downslope. However, deltaT50 was chosen as the primary variable, since tentative errors in the estimation of the maximum and minimum of the T wave downslope, which may occur due to noise, have a smaller effect on the interval at the steep 50% level than at the flatter 20 and 80% levels.
A study in 10 young, healthy subjects was initially undertaken to establish the proper conditions for the measurements of deltaT50, i.e. to investigate the effect of smoothing, the effect of added noise to the ECG signal, the relationship between changes in the RR and T50 intervals and the least number of beats for a reliable estimation of deltaT50. Recordings from another 32 subjects, 18 to 68 years old, were included to investigate whether measurements of deltaT50 should be corrected for age, heart rate (HR), T wave amplitude, heart rate variability (deltaRR) or QTcF.

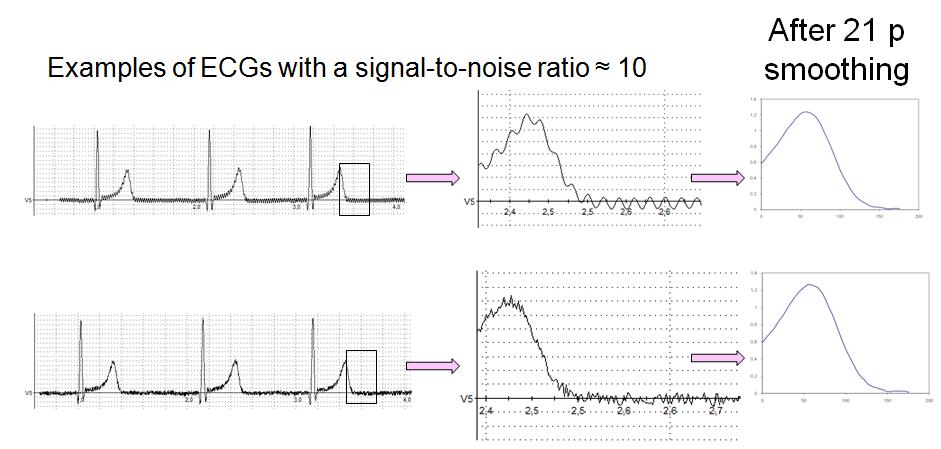
FIGURE 2:
Figure 2. The effect of noise and smoothing on deltaT50 was studied by adding noise of increasing amplitude to noise-free ECG signals. In these examples, sinusoidal (upper panel) or white noise (lower panel) was added, resulting in a signal-to-noise ratio of approximately 10 and a substantial increase in deltaT50. However, both the appearance of the ECGs and deltaT50 were normalized after 21 points of smoothing.
Smoothing is an efficient tool to iron out wrinkles on the ECG signal (Fig. 2). We started by investigating the effect of smoothing on noise-free signals and found that not even 21 points smoothing significantly altered deltaT50. When sigmoidal or white noise was added to the signals, deltaT50 increased in proportion to the amplitude of the added noise. However, 21 points smoothing restored the shape of the signal (Fig 2), and deltaT50 could be measured with high precision on signals with a SNR before smoothing of at least 10.
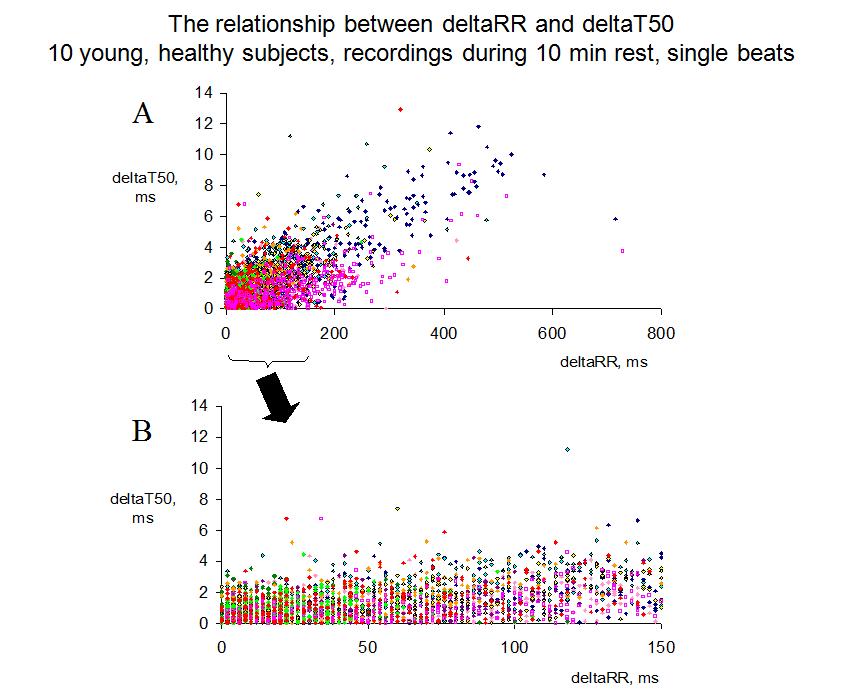
The beat-to-beat changes in the T50 interval were very small in the healthy subjects, on average 1.5 ms, but, as expected, large changes in the RR interval resulted in larger changes in the T50 interval (Fig 3A). To avoid the effect of these large changes in RR, which were only seen in the subjects with pronounced sinus arrhythmia, we decided to exclude all beat pairs where RR changed more than 150 ms (Fig 3B). This reduced the variability in deltaT50 both between and within the subjects, and a reliable estimation of deltaT50 could be done on only 9 beat pairs. We found no correlation between deltaT50 and age, gender, T wave amplitude, SNR or QTcF, but significant correlations to both HR and deltaRR. However, differences in HR and deltaRR explained only 2.6 and 3.5%, respectively, of the within subject variability, and only 10 and 19%, respectively, of the variability in deltaT50 between subjects. We therefore decided to measure deltaT50 without correction for any of these tentatively confounding factors.
The average deltaT50 was 1.5±0.41 ms in the 42 subjects, ranging from 0.86 to 2.84 ms, and correlated well between repeated measurements in the same subject.

FIGURE 3:
Figure 3. Panel A shows the beat-to-beat changes in the T50 interval (deltaT50) versus the change in the preceding RR interval (deltaRR) for all single beats recorded during 10 min of rest in 10 young, healthy subjects (one symbol/subject). With the deltaT50 method, all beats following a change in the RR interval of more than 150 ms are excluded, since not all subjects display this large RR variability, and, if so, only occasionally. When deltaRR ranged between 0 and 150 ms, deltaT50 seldom exceeded 4 ms (Panel B), and the average deltaT50 was 1.5 ms in this interval.
To summarize, the deltaT50 method can be used to measure beat-to-beat variability in cardiac repolarization time without corrections for age, gender, T wave amplitude, SNR, HR, deltaRR or QTcF.
- after 21 points smoothing of
- at least 9 pairs of ECG complexes with positive T waves and
- with a SNR of at least 10
- during changes in the RR interval between ± 150 ms.
The paper describing the method was recently published in Journal of Electrocardiology (please click here ).
Since AstraZeneca joined the THEW initiative last year, the deltaT50 method has been applied to the Holter ECGs from the healthy volunteers and the patients with Long QT Syndrome in the database, and these data will be used for further validation of the technology and to strengthen the link between increased repolarization variability and arrhythmia risk.