A dynamic model of QT/RR coupling |
|---|
by Josef Halámek, PhD(1); Pavel Jurák, PhD(1); Samuel J. Asirvatham, MD, FACC, FHRS(2) |
(1) Institute of Scientific Instruments - Brno, Czech Republic; (2) Division of Cardiovascular Diseases, Department of Internal Medicine - Mayo Clinic, Rochester, Minnesota |
Torsade de Pointe is a malignant arrhythmia associated with prolonged cardiac repolarization but is, however, frequently triggered by a sudden change in heart rate (RR interval)[1]. Thus, an ideal measurement of the QT interval should accommodate both QT dynamic, as well as static properties. Ideally, a QT/RR model should have a minimal number of parameters and yet effectively describe the static, and dynamic aspects of ventricular repolarization. In particular, the behavioral properties of QT inetrval occuring after a sudden change in heart rate. In this work, we describe a transfer function model of QT/RR coupling based on control system theory, tested, and optimized on multiple abrupt RR interval changes (exercise, mental stress, and tilt table testing) [2-4].
The model QT (QTm) is given by the recursive relation among intervals
![]()
where qtxm and rrx are intervals with subtraction of mean levels QTxm=QTm-mean (QT), RRx=RR-mean (RR). Fitted parameters a1, b2, b3 are subject specific and are given by minimizing the residual between detected QT and QTm. An example of agreement is shown in Figure 1.
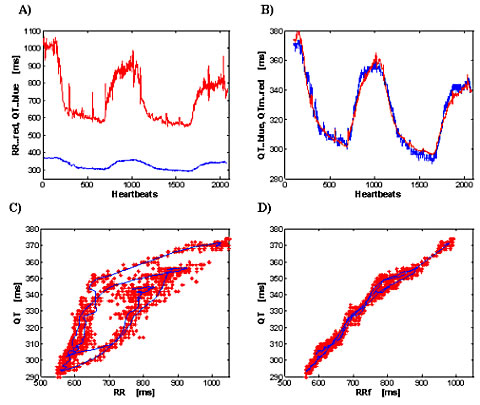
FIGURE 1:
Fig 1. Effect of bicycle stress: 50 year-old-male healthy volunteer. a) Detected RR and QT intervals. b) The agreement between detected QT and computed QTm. c) QT as a function of RR; red marks are single beats; the continuous blue line is the running average of QT and RR over 40 beats; d) QT hysteresis elimination by the model. RRf is filtered RR, detailed description is in [3].
The QT interval response after an abrupt change of RR is called the QT step response and it is computed by fitting the model described above (a1, b2, b3). The QT parameters are determined from the step response described in Figure 2. The suggested QT parameters includes:
- GainL: The gain of QT/RR coupling for slow variability of RR, i.e. the QT/RR slope, i.e. the amplitude of QT change that is achieved in steady state.
- GainF: The gain of QT/RR coupling for fast variability of RR, i.e. the amplitude of QT change immediately after the change of RR.
- The delay τ is the number of heartbeats after which the step response has achieved 90% of the change needed to attain the new steady state value.
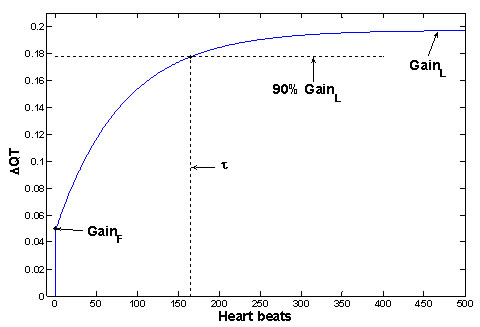
FIGURE 2:
Fig 2. The example of QT step response (for subject from Figure 1) and demonstration of QT parameters of physiological significance. The step response (i.e. the behavior of QT after unit sudden change of RR) is computed from fitted parameters a1, b2, b3. Similar shapes of step responses were achieved over all analyzed measurements, and the shapes are in good agreement with previous measurements [5-7].
The full set of QT parameters is given by these parameters (GainL, GainF, τ) and by QTc and QT random variability computed from the model. The effect of the QT hysteresis is minimized by this model as sjown in Figure 1 [3].
In conclusion, the advantages of the dynamic QT/RR model are:
- The QT static and dynamic properties are modeled.
- In comparison to other models, the residual between computed QTm and detected QT is minimized and the elimination of QT hysteresis is obtained [3, 4].
- The shape of the QT step response correlates well with prior measurements [5-7]. It should be emphasized that this shape is a result of analysis and no apriori assumption about the shape is used for the analysis.
Technical requirements associated with dynamic QT/RR modeling:
A) Need for continuous long recordings:
- Significant RR excitation is needed (preferably more than 200 ms change), and a sufficient number of associated QT intervals must be detected requirement for beat-to-beat QT is obvious. Similar need exists in the model based on exponential weighting of RR intervals [8, 9]. Consequently, these methods are dependent on the accurary of the QT measurement algorithm.
- The QT parameters are not only subject specific, but also excitation specific. Only excitation specificity may explain different triggers of QT arrhythmias[1], different QT behavior with different stress[10], and different QT/RR slope between different autonomic regulation.
Summary
The analysis of the dynamic and static properties of QT/RR relationship will help to better understand the QT physiology. Today drug cardiotoxicity are evaluated while neglecting both QT dynamic properties and excitation dependent QT coupling.
It is well known that abrupt changes in the level of arousal or physical activity is a well-established trigger for malignant ventricular arrhythmia in patients with repolarization abnormalities [1]. We therefore hypothesized that significant differences in the QT interval during early excitation relative to the steady state may assist our understanding of why there is a higher prevalence of malignant arrhythmia in certain situations. Such dynamic differences of QT intervals are directly proportional to the level of the QT/RR slope and the time constant of QT adaptation, and indirectly proportional to the level of GainF.
The QT behavior on a sudden change of RR, relative to steady state, is demonstrated in Figure 3. The QT step response is given by the blue line, the QT steady state level by the black line. The QT difference is given by the red line, and corresponds to the dotted area between the step response and the steady state level of QT. The maximal amplitude of difference is seen at the time of RR change, and its level is (GainL - GainF )*ΔRR. The duration of QT difference depends on the time constant τ.
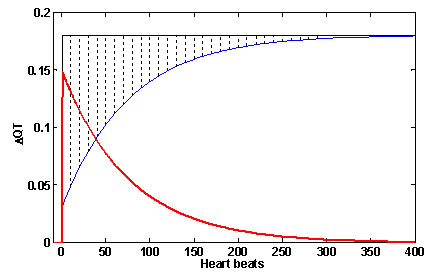
FIGURE 3:
Fig 3. The QT difference from steady state in sudden change of RR. The QT step response is blue line; the QT steady state level is the black line. The QT difference, given by delayed QT adaptation, is the red line; it corresponds to the dotted area between step response and steady state level.
The dynamic aspects of QT interval coupling is likely to describe the clinical behavior of cardiac repolarization during the onset and offset of excitation, which in turn may assist our understanding of why “Torsades de Pointes” initiates in some circumstances and not others despite comparable levels of activity or rest. Furthermore, the testing of drug effects on QT dynamic parameters may elaborate why gender and certain specific physical states are more associated with drug-induced proarrhythmia. The proarrhytmic influence of drugs may originate in a change of GainL, GainF or τ without any change in QTc.
References:
[1] Schwartz PJ, Priori SG, Spazzolini C, Moss AJ, Vincent GM, Napolitano C, Denjoy I, Guicheney P, Breithardt G, Keating MT, Towbin JA, Beggs AH, Brink P, Wilde AA, Toivonen L, Zareba W, Robinson JL, Timothy KW, Corfield V, Wattanasirichaigoon D, Corbett C, Haverkamp W, Schulze-Bahr E, Lehmann MH, Schwartz K, Coumel P, Bloise R: Genotype-phenotype correlation in the long-QT syndrome: gene-specific triggers for life-threatening arrhythmias. Circulation 2001; 103:89-95.
[2] Halamek J, Jurak P, Villa M, Soucek M, Frana P, Nykodym J, Eisenberger M, Leinveber P, Vondra V, Somers VK, Kara T: Dynamic coupling between heart rate and ventricular repolarisation. Biomed Tech (Berl) 2007; 52:255-263.
[3] Halamek J, Jurak P, Bunch TJ, Lipoldova J, Novak M, Vondra V, Leinveber P, Plachy M, Kara T, Villa M, Frana P, Soucek M, Somers VK, Asirvatham SJ: Use of a novel transfer function to reduce repolarization interval hysteresis. J Interv Card Electrophysiol 2010.
[4] Halamek J, Jurak P, Vondra V, Lipoldova J, Leinveber P, Kara T: Dynamic Properties of QT Intervals. Computers in Cardiology 2009; 36:517−520.
[5] Lau CP, Freedman AR, Fleming S, Malik M, Camm AJ, Ward DE: Hysteresis of the ventricular paced QT interval in response to abrupt changes in pacing rate. Cardiovasc Res 1988; 22:67-72.
[6] Franz MR, Swerdlow CD, Liem LB, Schaefer J: Cycle length dependence of human action potential duration in vivo. Effects of single extrastimuli, sudden sustained rate acceleration and deceleration, and different steady-state frequencies. J Clin Invest 1988; 82:972-979.
[7] Padrini R, Speranza G, Nollo G, Bova S, Piovan D, Antolini R, Ferrari M: Adaptation of the QT interval to heart rate changes in isolated perfused guinea pig heart: influence of amiodarone and D-sotalol. Pharmacol Res 1997; 35:409-416.
[8] Malik M, Hnatkova K, Novotny T, Schmidt G: Subject-specific profiles of QT/RR hysteresis. Am J Physiol Heart Circ Physiol 2008; 295:H2356-2363.
[9] Pueyo E, Smetana P, Caminal P, de Luna AB, Malik M, Laguna P: Characterization of QT interval adaptation to RR interval changes and its use as a risk-stratifier of arrhythmic mortality in amiodarone-treated survivors of acute myocardial infarction. IEEE Trans Biomed Eng 2004; 51:1511-1520.
[10] Van Huysduynen BH, Swenne CA, Van Eck HJ, Kors JA, Schoneveld AL, Van De Vooren H, Schiereck P, Schalij MJ, Van Der Wall EE: Hypertensive stress increases dispersion of repolarization. Pacing Clin Electrophysiol 2004; 27:1603-1609.