The dynamic beat-to-beat method |
|---|
by Anthony Fossa, PhD |
June 22, 2010 |
The dynamic QT beat-to-beat (QTbtb) analysis has been reported to differentiate changes of QT interval duration due to heart rate or autonomic state from impaired repolarization. This work has recently been reviewed with both clinical [1] and preclinical translational data [2,3]. The method utilizes all individual cardiac cycles from continuously collected ECG telemetric or Holter data to define the normal baseline which contains different autonomic states experienced over 24-hours. The baseline QT-RR boundaries therefore also contain beats incurred during all normal hysteresis (defined as the lag in QT interval adaptation for changes in RR interval), sinus arrhythmia and QT-RR variability during activities such as eating, sleeping and ambulatory movements. The upper confidence bound for the baseline of all beat-to-beat QT interval values is defined across the entire 24-hr RR interval range and beats exceeding this limit are flagged as outlier beats for further arrhythmia vulnerability assessment. These beats would be assumed to possess potential risk of arrhythmia and can be further analyzed by quantifying the temporal heterogeneity or assessment of ECG restitution of the entire dataset (described below).
Using the individual 24-hr predose data as a baseline for all subsequent analyses (Figure 1, panel A), the effect of a drug, placebo and baseline-adjusted placebo corrected value can be readily assessed. For any specific time point or timeframe, all continuously collected viable beats are analyzed with rigorous automated quality control procedures. This is usually a 5 min period during drug administration and its time-matched placebo (Figure 1, panel B). The center of this 5-min cloud of data or centroid is calculated as the median QT and the median RR interval (Figure 1, panel C). This median QT value (QTbtb) value for any nominal time point is compared to the centroid of all beats extracted within a similar RR interval range (e.g. ± 12 ms) from the 24-hr baseline dataset to provide a delta-QTbtb value (Figure 1, Panels D, E and F).
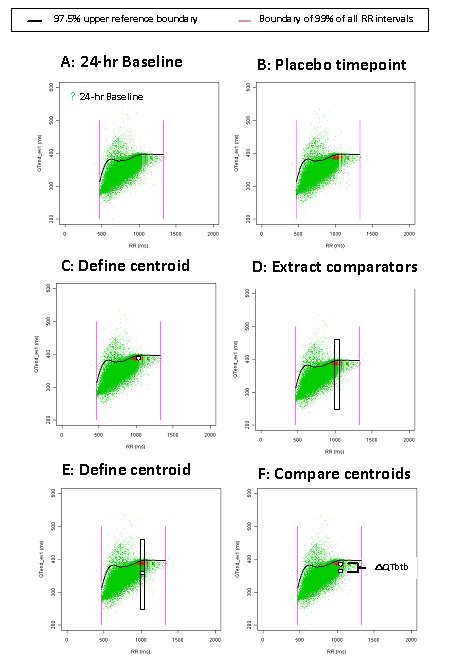
FIGURE 1:
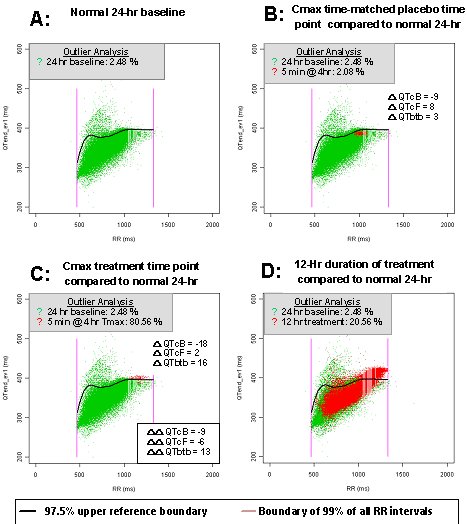
The beats used to calculate the delta-QTbtb for the nominal time points can also be used for calculating the corrected QTcB or QTcF values for simultaneous comparison (Figure 2). The same procedure used to define the delta-QTbtb value for placebo can then be applied for the on-drug treatment nominal time points. The placebo-adjusted time-matched values (delta-delta QTbtb) are simply calculated by subtraction of the time-matched placebo values from the same time-matched values on treatment from the same subject. However, one advantage of using continuous ECG collection with beat-to-beat analyses is that entire timeframes of data when on-drug can be compared to off-drug periods to quickly determine whether an effect is present by the outlier methods described below (Figure 2, panel D).
An essential component of the beat-to-beat method is to determine whether repolarization is significantly impaired beyond normal autonomic boundaries by applying quantile regression techniques to define the upper 97.5% reference boundary of QT over RR intervals from the normal 24-hr data (See Figure 2 from baseline day of the study).
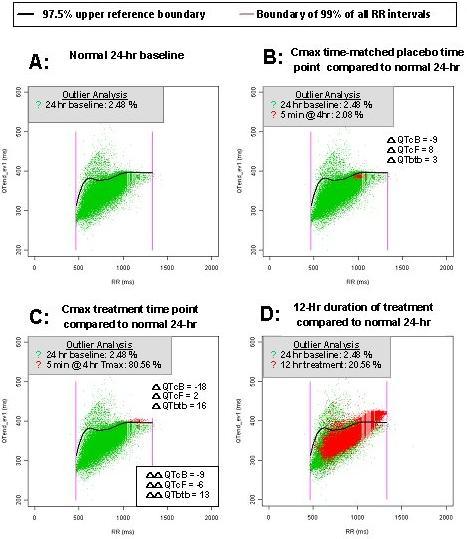
FIGURE 2:
An outlier analyses examines the percentage of beats that exceed the upper 97.5% reference boundary of the baseline data during any period. By definition, for a drug with no effect this percentage should be around 2.5 % of beats exceeding the upper boundary. The % outliers values can be handled as described above for QTbtb values and thus a time-matched placebo adjusted value can be obtained for each time point. A lower 90% two-sided confidence interval can be determined for the mean of the % outlier values at any time point to determine whether there is a statistically significant increase in outliers. As mentioned above, this same type of analysis can also be conducted for any period of time that the drug is used, including the entire time at efficacious concentrations to readily ascertain the net effect of drug vs. normal QT/RR relationship.
Arrhythmia liability due to changes in temporal heterogeneity of outlier beats can be assessed by a bootstrap analysis applied to only beats that exceed the upper 97.5% reference bound. The median value during any time period on-drug is determined to ascertain whether these beats are of greater magnitude in general compared to beats normally exceeding the upper 97.5% reference bound of QT intervals off-drug. Bootstrapping provides confidence intervals of the median value. The width of the confidence intervals is used as a measure of heterogeneity of the QT interval outlier beats, which has been associated with increased arrhythmia liability and can be compared to the width of the confidence intervals at normal levels from the same individual when obtained off-drug.
A second procedure to evaluate arrhythmia liability of temporal dynamics is to evaluate the cardiac ECG restitution. Restitution is the ability of the heart to recover from one beat to the next. This measures the QT interval (working phase of the heart) in relationship to the previous TQ interval (resting phase of the heart). When the heart is not under stress, this ratio is less than 1, meaning the heart is resting more than it is working. However, as stress increases on the heart, for example, during exercise, the heart works more than it rests, increasing this ratio to greater than 1. Sustained periods with inadequate recovery between beats would presumably lead to increased arrhythmia vulnerability as occurs in extreme cases with salvos of non-sustained ventricular tachycardia or an R on T phenomenon where TQ interval equals zero. Arrhythmia liability not associated with QT prolongation may be more related to the TQ interval shortening or increase in the QT/TQ ratio of each beat. When QT prolongation is present along with increase QT and RR variability or increased heart rate during proarrhythmic states, the QT/TQ ratio can increase dramatically for transient periods of time possibly leading to initiation of reentry. Thus in addition to the median QT interval, the median TQ interval and median QT/TQ ratio are assessed in ECG restitution. Other parameters to describe length of stress and magnitude of extreme changes are defined as % beats greater than 1 and upper 98% bounds for the QT/TQ ratio, respectively.
References
1. Fossa AA and Zhou M. Assessing QT prolongation and electrocardiography restitution using a beat-to-beat method. (2010) Cardiol
J 17:230-243.
2. Fossa AA. Assessing QT prolongation in conscious dogs: Validation of a beat-to-beat method. (2008) Pharmacol and Therapeutics 118: 231-238.
3. Fossa AA. The impact of varying autonomic states on the dyamic beat-to-beat QT-RR and QT-TQ interval relationships (2008) Br
J Pharmacol 154:1508-1515.