| Biomedical Systems, St. Louis, MO,USA |
| Vivaquant LLC, St. Paul, MN ,USA |
Sensium Healthcare Ltd, Oxfordshire,UK. |
Seoul National University, Gwanak-gu, South Korea. |
Boston Scientific Inc., Marlborough, MA, USA |
Learn more about our members: here |
| |
| New THEW publications: |
Page A, Aktas MK, Soyata T, Zareba W, Couderc JP.The "QT Clock" to Improve Detection of QT Prolongation in Long QT Syndrome Patients.Heart Rhythm. 2015 Aug 31. pii: S1547-5271(15)01127-3. doi: 10.1016/j.hrthm.2015.08.037. [Epub ahead of print]
PMID: 26334569 |
| Firoozabadi Reza, Gregg Richard E., Babaeizadeh Saeed. Identification of Exercise-Induced Ischemia using QRS Slopes. Journal of Electrocardiology (2015), doi:10.1016/j.jelectrocard. 2015.09.001 |
Boonstra, M.J. and Leeuwen, K.G. van and Porte, F.M. and Spijkerboer, F.L. (2015) Quantification of postoperative atrial fibrillation by automatic analysis of electrocardiograms. A study to find incidence and burden of PoAF after open chest surgical aortic valve replacement. PhD thesis, Erasmus Program, University of Twente, Netherland |
Rivolta, Massimo Walter, Roberto Sassi, and Ernesto Damiani. Non-Blind Source Separation and Feature Extraction: Theory, Approach and Case Studies in Cardiac Signals. PhD thesis, Milan University, Italy |
Kocabaş, Övünç, and Tolga Soyata, Towards Privacy-Preserving Medical Cloud Computing Using Homomorphic Encryption. IGI Publishers (2015). |
Rivolta M W, Mainardi L T and Sassi R 2014 Quantification of ventricular repolarization heterogeneity during moxifloxacin administration using V-index 8th Conf. of the European Study Group on Cardiovascular Oscillations et al Physiological Measurement 36 (2015) 803-811 doi:10.1088/0967-3334/36/4/803 |
www.thew-project.org |
 |
Keep updated about our initiative. Register to our LinkedIn group - 682 registered members. |
|


|
Should we believe in T-wave morphology ?
EDITORIAL by JP Couderc, PhD- Founder of the THEW |
The cardiologists who are experts in the field of the congenital long QT syndrome have this remarkable ability to rightly guess the LQTS type by reviewing the patient's 12-lead standard ECG. One of the features of the electrocardiographic recordings that seem to play the major role in discriminating the different types of channelopathies is the "T-wave morphology", these phenotypic features were reported in a landmark paper published in 1995 by Dr. A.J. Moss, which describes the genotype-phenotype association as follows: broad-base high-amplitude T-wave in LQT1, low-amplitude T-wave in LQT2, and late appearing T-wave in LQT3. These observations led scientists to conduct research projects investigating the following questions: Can T-wave morphology complement QTc interval in identifying the patients carrier of LQTS mutation(s) with borderline QTc interval duration (this group of “borderline” patients is estimated to be around ~25% of carriers of LQTS mutation [pubmed])? Can we complement the QT/QTc interval prolongation as a risk marker of cardiac arrhythmias in the acquired and congenital LQTS? Can we use T-wave morphology to help early identification of the LQTS type and help clinicians to better select their treatment strategy for these patients?
Multiple academic groups tackled these issues; they develop various methods for the quantification of T-wave features in the congenital and acquired form of the LQTS, these measure T-wave amplitude, symmetry duration, area, notching, etc... Most of these technologies have been licensed by industries but unfortunately as of today, none of these methods have been adopted and are routinely used in either clinical settings or drug safety evaluation. The reason for this lack of adoption is two folds: 1) the genesis of the T-wave shape is not well understood, scientists are still debating the roles of transmural versus intra/inter vetricular voltage grandiant in the formation of the T-wave, and 2) there is a limited set of data available today to convincingly demonstrate the interest of these new biomarkers in both the congenital and acquired form of the syndrome. To elucidate these questions, one must develop a comprehensive research plan combining basic science, cardiac modeling, cardiac electrophysiology, ECG expertise, and an access to large amount of relevant data.
As an example of efforts in this research arena, Dr. Massimo Rivolta investigated the impact of distribution of cardiac cells in a high-resolution human wedge on the morphology of T-wave in collaboration with IBM. His work was awarded during the Computing in Cardiology Meeting held in France last month for describing very elegantly the genesis of transmural T-waves. As noted above, the availability of large amount of human clinical data will become crucial to the evaluation of T-wave morphology, the THEW initiative is currently working on gathering ECGs and clinical information from registries, clinical trials and drug studies. We primarily focus on long-term continuous data (Holter) in order to enable scientists to conduct both static and dynamic analysis of the ventricular repolarization. Too often , T-wave morphology has been studied in short-term recordings neglecting its dynamic profile while it was demonstrated that ventricular repolarization and T-wave morphology are very dynamic phenomena. Analyses based on THEW data showed that the T-wave amplitude is heart rate dependent and its dependency is modified by the presence of drugs (pubmed). A recent work from our "expert opinion section" of this issue, describes an elegant infographic concept called the "QT clock" applied to Holter recordings of patients with the congenital long QT syndrome to quickly assess abnormal prolongation and dynamics of the QT intervals. The THEW LQTS database used in these work was shared by the French group led by Prof. F. Extramiana and Maison-Blanche and it is, as of today, the largest database of Holter recordings from genotyped LQTS patients readily available for research. We are currently working on multiplying by four the size of this database with the support from the NIH. We are gathering data from American, German, Italian and French LQTS registries. In paralell, we are expanding our pool of data from drug studies, we are glad to announce a new database from a drug study developed by the scientific research group led by Dr. David Strauss at the FDA. This dataset was announced in our last February Newsletter, it contains the full set of continuous Holter recordings from which 12-lead ECGs were extracted and shared at the begining of this year 2015 (see database E-OTH-12-5232-020). With this new addition, we are enabling the sharing of the full dataset of continuous signals from this very same FDA drug study. This study was developed to assess the ability of novel electrocardiographic biomarkers to differentiate the effects of single- and multichannel drugs on the QT/QTc interval and the morphology of the T-wave signal. It represents a crucial set of data for scientists involved in this field of research.
To conclude, T-wave morphology could play a role in both the clinical and drug-safety worlds once scientists have gathered the right data and developped a comprehensive description of the T-wave genesis. Importantly, the dymanic features of T-wave morphology has been neglected so far and it remains to be studied thorouthly, we hope our intiative will help enabling this type of work.
---
Also, we announce the inclusion of a second dataset from a study investigating AF treament, and especially the electrical cardioversion of atrial fibrialltion (AF). Continous ECG were recorded before, during and after electrical cardioversion in 26 patients with persistent atrial fibrillation. This study was funded by Xerox corp. The ECG durations vary between subjects but they always include baseline period (prior to conversion) and a post-cardioversion period. ECGs were continuously acquired during the overall procedure. Twenty of the subject successfuly converted to sinus rhtyhm while 6 of them did not.
The "THEW" digitial repository is growing nicely and we hope that our efforts will enable more scientists and engineers to develop unique and exciting new technologies in the field of quantitative electrocardiology. For more information about these data and technology please visit our website at http://thew-project.org. |
| Expert Opinion: The QT clock concept |
by Alex Page, MS
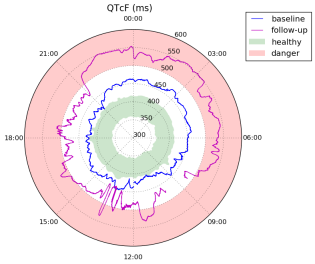
Prolongation of the QTc interval is known to occur during different activities or times of day depending on LQT genotype [1]. Holter recordings are therefore essential in capturing the full scope of a LQTS patient's QTc variation. Further, differences in age, gender, or therapies can make it difficult for a clinician to judge whether a QTc measurement is “normal”. To address these issues, we have developed the “QT Clock” method, which provides a visual representation of a patient's QTc throughout the day (in reference to the expected range for similar or healthy individuals).The clock is a polar plot in which the angle represents time of day and the radius is QTc. An example is given here:
|

This plot shows QTc over two Holter recordings of a male LQT2 subject. The baseline (blue) was recorded at age 3, and the follow-up (magenta) at age 5. The red region simply highlights QTc>500ms, a typical warning range [2]. The green region is more dynamic; it is defined as the 5-95 percentile range of QTc, minute to minute, for the 100 healthy male patients in the E-HOL-03-0202-003 database of the THEW. |
To continue reading the article please click here.
|
| THEW Team Member |

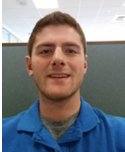
Connor Besaw, Technical Associate |
Connor Besaw is the newest member of the THEW team. Mr. Besaw is a native of Massena (NY), and recently graduated from The College at Brockport. Connor holds a BS in Exercise Science and has experience working in cardiac rehabilitation at the University of Rochester, as well as involvement in research focused on exercise recovery. His primary responsibilities in the THEW organization include the management of user access requests, organization of user agreements and administration forms, and providing technical support to THEW users |
|
