Newsletter Issue 11, April 2011 |
|---|
New database: High-resolution ECG from 927 consecutive patients referred |
for exercise and myocardial perfusion single photon emission computed tomography (SPECT) |

- Editorial
- New THEW servers hosted by the University Enterprise Computing Center
- New Database: 900 high-resolution ECGs from patients undergoing exercise-testing available in the THEW.
- High-Frequency QRS Analysis: From the Research Lab to the Clinical Markey by Guy Amit, PhD
- Profiling the THEW Team
Editorial by JP. Couderc, PhD
In this first THEW Newletters of the year, we describe the most important developments of our initiative between December 2010 and March 2011. First, the THEW IT hardware has been physically moved to the University Enterprise Center, a $20M fully-secured computing center managed by the University of Rochester. We describe this new site for the THEW data in the first article. In addition to its high-level security, this organization provides full 24-hour support to our Center with unlimitted access to storage space and high-speed network. Second, we are glad to continue to expand the THEW with a novel dataset of ~20-minute continuous 12-lead ECGs from 927 patients recorded during stress test (Bruce protocol). This new set of recordings is described in details below, it includes full beat annotations which have been manually reviewed and adjusted by the THEW ECG technicians. In addtion to the high-frequency ECG signals, the myocardial perfusion scores are available in the associated THEW clinical database. Third, we are glad to have our expert opinion section covered by Dr. Guy Amit (Biological Signal Processing Ltd., Tel-Aviv, Israel) presenting the high-frequency QRS analysis technology developed and validated using these 927 patients. Finaly, we would like to welcome our new academic members that include Johns Hopkins School of Medicine, the Academy of Medical Sciences of China, the School fo Computing and Mathematics from the United Kingdom, and finaly the Department of Electrical and Electronic Engineering from the University of Melbourne, Australia.
We hope you will enjoy this Newsletter and please do not hesitate to contact our group if you have any questions.
New THEW servers hosted by the University Enterprise Computing Center

The hardware of the THEW repository has been moved to the University Of Rochester Enterprise Computing Center (ECC). The ECC is a $20M computing center declared "operationally stable" on June 4, 2009 after intense testing. One half of the facility (approx 21,000 sq ft) was reconstructed to support an 8000 sq ft datacenter. The primary data center is staffed 24 hour per day, 365 days per year. It is classified as: - Uptime Institute Tier III: composed of multiple active power and cooling distribution paths, but only one path active, has redundant components, and is concurrently maintainable, providing 99.982% availability- Bruns – Pac – Reliability 8: Reliable Redundant Data Center with dedicated power and cooling systems, redundant UPS systems, redundant dedicated A/C units and redundant generators The ECC has redundant fiber optic cables into the facility on diverse paths from two directions. Each fiber path terminates in the data center on redundant optical nodes. Systems are backed up to tape each day to an offsite backup location – Open system backups are not made at, or retained at the center. Tapes are stored in a University tape vault, secured by card swipe and video surveillance and monitored 24x7x365 by Data Center personnel. The Data Center Operations maintains a complete set of operating processes and procedures in both hardcopy and electronic formats. Data Center requires change control processes for all hardware and software modifications. This process is documented in the ISD or UnivIT Change Management Procedures The physical security of the building is ensured by card access swipe systems at all perimeter exterior doors and all interior doors within the data center space (raised floor, mechanical and electrical).Video intercom at all perimeter doors connected directly to Operations Command Center. Video surveillance monitoring covers 100% of the building's exterior, as well as interior monitoring of all common areas and raised floor space. Video is digitally recorded and retained for 15 days. University Security road patrols visit the center on a non-standard schedule multiple times each day, 24 hours per day 365 days per year. The ECC hosts digital information from clinical trials in collaboration with pharmaceutical companies.
 This database includes 927 consecutive patients referred for exercise myocardial perfusion single photon emission computed tomography (SPECT) in two medical centers (Assuta Medical Center, and Sheba Medical Center). Exclusion criteria were cardiac pacemaker, atrial fibrillation at the time of testing and QRS duration ≥ 120 msec. The exercise protocol was as follow: beta blockers and calcium channel blockers were discontinued at least 48 hours before testing. A symptom-limited treadmill exercise test was performed using the Bruce protocol. High resolution 12 lead ECG (HyperQ™ Stress System, BSP Ltd, Tel Aviv, Israel) was continuously recorded throughout baseline, exercise and recovery phases. ECG acquisition was performed at a rate of 1000 samples/second using 16 bit resolution (measurement sensitivity < 0.15µV), with an analog frequency response of 0.05 to
125
Hz. Conventional ECG monitoring during the exercise test was either extracted automatically from the high resolution ECG traces or acquired using an additional ECG device (Q-Stress, Quinton Inc, WA), using a second set of 10 electrodes.
The patients underwent either stress/rest 99mTc-sestamibi gated SPECT, or stress/ redistribution 201Tl SPECT.
The 99mTc-sestamibi protocol: a dose of 10 mCi 99mTc-sestamibi was injected at peak stress, and exercise was continued for an additional minute at peak stress, and two minutes at one lower exercise level. Gated SPECT acquisition was initiated 15-30 minutes later, using a 90° dual-detector gamma camera (Axis, Philips Medical Systems, Cleveland, OH, or CardiaL, GE Healthcare, Israel) equipped with LEHR collimators. Acquisitions were performed using 60 projections, 30-33 sec/projection, over 180° circular orbit. ECG gating was performed using 8-frames and a 100% acceptance window. Resting images were acquired 3.5-4 hours later, one hour after injection of an additional 30 mCi 99mTc-sestamibi, over 23-26 sec/projection.
The 201Tl protocol: a dose of 2.8-3.5 mCi 201Tl (adjusted to patient weight) was injected at peak exercise. SPECT acquisition was started 8-12 minutes following stress, using a 90° dual-detector gamma camera (Axis, Philips Medical Systems, Cleveland, OH, CardiaL, GE Healthcare, Haifa, Israel or Varicam, GE Healthcare, Haifa, Israel) equipped with LEHR collimators. Acquisitions were performed over 180° circular orbit using 60 projections, 22-26 sec/projection at Assuta Medical Center or 30 projections, 40 sec/projection at Sheba Medical Center. Redistribution images were acquired 3-4 hours later using 60 projections, 25-29 sec/projection at Assuta Medical Center or 30 projections, 40 sec/projection at Sheba Medical Center. Reinjection of 0.5-1 mCi 201Tl was administered whenever a severe perfusion defect was identified in the stress images. Images were reconstructed using filtered back projection, with a Butterworth post-filter. No attenuation or scatter correction was applied at Assuta Medical Center; attenuation correction was applied at Sheba Medical Center.
Perfusion images were visually scored using a 20-segment model of the left ventricle and a 5-point scale (0=normal tracer uptake, 1=mildly reduced, 2=moderately reduced, 3=severely reduced, 4=no uptake) (2). This analysis was performed by expert interpreters (TS or PC), over-riding automatic segmental scores, obtained by commercial software (QPS, Cedars Sinai Medical Center, Los Angeles, CA). The summed stress score and summed rest score were calculated as the sum of the individual segment scores for the stress and rest images and converted to percent total myocardium (% myocardium) by dividing by 80 (maximal potential score = 4 × 20). The amount of ischemic myocardium (IM) was calculated as the summed difference score (the difference between summed stress and summed rest scores) divided by 80. Patients were classified as: no ischemia or equivocal (IM<5%), mild ischemia (5%≤IM<10%) and moderate/severe ischemia (IM≥10%) (3, 4).
References available here .
High-Frequency QRS Analysis: From the Research Lab to the Clinical Market
By Guy Amit, PhD., Biological Signal Processing Ltd., Tel-Aviv, Israel
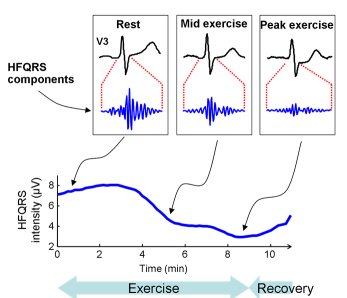
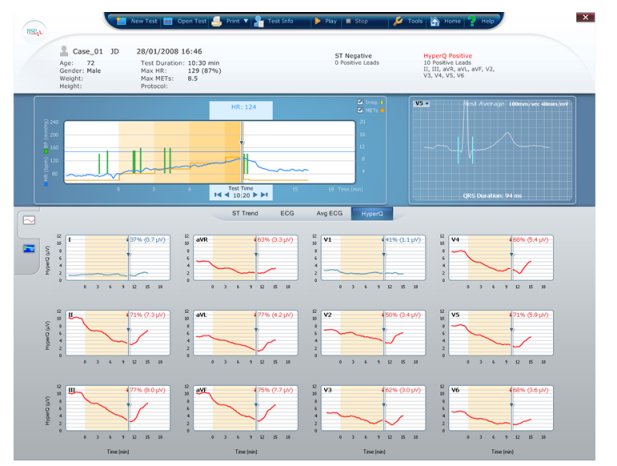
Ischemic heart disease (IHD) is a major healthcare problem worldwide. In the US alone, there are 1 7 . 6 million IHD patients, and the estimated annual incidence of new and recurrent myocardial infarction is estimated to be 935,000 (1). ECG retains its central role as the first-line diagnostic modality for ischemic heart disease workup in both chronic and acute presentations. Electrocardiographic detection of myocardial ischemia is typically based upon identification of repolarization abnormalities, manifested as changes in the ST-T segment. However, ischemia also induces changes during the depolarization phase, which can be detected and quantified by analyzing the high-frequency components of the QRS complex (HFQRS). HFQRS components are very low in amplitude and are typically filtered out by conventional ECG devices. The HFQRS signal originates from the fragmentation of the electrical activation wavefront in the myocardium, caused by the branching nature of the conduction system. In ischemic regions of the myocardium, local slowing of conduction velocity reduces the wavefront fragmentation, causing changes in the intensity and morphology of HFQRS signals (2). Over the last 30 years, HFQRS have been extensively studied in computer simulations, animal models, humans during coronary balloon occlusion and patients undergoing exercise test (2-7). Analysis of HFQRS has been reported to be more sensitive and specific than conventional ECG interpretation in detecting exercise-induced ischemia (5-7). Recently, Biological Signal Processing Ltd. (BSP) has introduced the HyperQ™ EX300 stress system, which provides automated HFQRS analysis in a commercially-available exercise ECG system. The system's technology is based upon sophisticated signal processing algorithms that perform accurate QRS alignment and averaging, band-pass filtering in the frequency range of 150 to 250 Hz, and computing of the root-mean-square intensity of the HFQRS signal. The trend of HFQRS intensity in 12 leads throughout the exercise test is then examined, and the relative intensity reduction is used as an index of ischemia (Figure 1).

FIGURE 1:
Figure 1: Example of conventional ECG and HFQRS obtained in an ischemic patient (top), and the HFQRS analysis provided by the HyperQ EX-300 system (bottom). Note the marked reduction in HFQRS intensity with exercise. (click to enlarge)
The HyperQ index of ischemia was studied in 996 patients (age 58.9±10.2 years, 670 men), referred for exercise nuclear scan, which was used as the gold standard of ischemia. HyperQ response correlated with severity of ischemia, and was more sensitive (69% vs. 39%, P<0.005) and more specific (86% vs. 82%, P<0.05) than ST segment analysis. Multivariate logistic regression indicated considerable incremental diagnostic value of HyperQ over pre-test likelihood of CAD and exercise parameters (7).
Ongoing research efforts are aimed to establish HFQRS analysis as a routine adjunct to workup of IHD, and to develop new clinical applications of the technology. Of particular interest are the utilization of HFQRS for early detection of acute myocardial ischemia in patients presenting with chest pain, continuous monitoring of patients in risk of transient ischemic episodes and identification of ischemia from intra-cardiac pacing leads.
References
- Lloyd-Jones D et al. Heart Disease and Stroke Statistics--2010 Update. A Report From the American Heart Association. Circulation 2010; 121:e46-e215.
- Abboud S et al.. Simulation of high-resolution QRS complex using a ventricular model with a fractal conduction system. Effects of ischemia on high-frequency QRS potentials. Circ Res 1991;68:1751-1760.
- Abboud S. Subtle alterations in the high-frequency QRS potentials during myocardial ischemia in dogs. Comput Biomed Res 1987; 20(4):384-395.
- Abboud S et al. Detection of transient myocardial ischemia by computer analysis of standard and signal averaged high frequency ECG in patients undergoing percutaneus transluminal coronary angioplasty. Circulation 1987;76:585-96.
- Pettersson J et al. Changes in high-frequency QRS components are more sensitive than ST-segment deviation for detecting acute coronary artery occlusion. J Am Coll Cardiol 2000;36:1827-34
- Toledo E et al. Detection of Stress-Induced Myocardial Ischemia from the Depolarization Phase of the Cardiac Cycle - A Preliminary Study. J Electrocardiol 2009; 42:240-9
- Sharir T et al. Detection of Stress-Induced Myocardial Ischemia Using Analysis of Depolarization Abnormalities. J Am Coll Cardiol 2009;53:A297
Patricia Cermark: maintaining the THEW database for members' information and email communications
 Patricia Cermak is a native of Penn Yan, N.Y. and is a graduate of Rochester Business Institute with a degree in Secretarial Science. Pat came to the University fo Rochester Medical Center in 2006 after working 30 years for Rochester's Eastman Kodak Company. Pat is involved in the maintenance of the THEW member database.
