Measuring beat-to-beat variability in ECG using two-dimensional signal warping. |
|---|
By Mathias Baumert PhD, Associate Professor Australian Research Fellow, Heart Health | School of Electrical & Electronic Engineering , The University of Adelaide, email: mathias.baumert@adelaide.edu.au
The morphology of ECG waveforms varies slightly from beat to beat. Quantification of these changes, in particular within the ST-T segment, has been receiving increasing interest, because electrocardiographic phenomena such as microvolt T wave alternans and augmented QT interval variability have been associated with malignant ventricular arrhythmia in clinical populations as well pro-arrhythmic risk in pharmacological safety testing studies. More recently, P wave variability has received attention by cardiologists due its potential link to atrial fibrillation propensity. Since all those ECG changes are typically very small, high precision as well as robustness of the measurement algorithm are of utmost importance for obtaining reliable results.
The technique proposed in [1] provides a general framework for analysing beat-to-beat changes in ECG and can be utilized for accurately tracking changes in common features of interest, e.g. the P, QRS or QT intervals or amplitude related information. The algorithm first generates a template beat based on ensemble averaging of relatively noise-free beats. Features of interest are annotated on the template in a semi-automated fashion. The template is then adapted to each incoming beat by exploiting a technique called two-dimensional signal warping. In brief, a 2D mesh of warping points is superimposed on the template beat. The
se warping points are sequentially shifted in x- and y-directions, minimizing the Euclidean distance between segments of the template and the incoming beat. From the optimally adapted template, changes in annotated features can be quantified, providing the foundation for beat-to-beat ECG variability analysis.
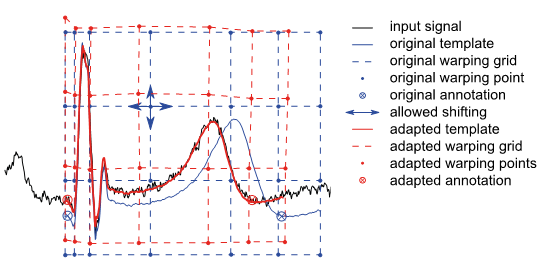
Figure: Illustration of the two-dimensional signal warping algorithm. The template beat (blue) is mapped to a warping grid (blue), which is adapted to the incoming beat (black) by moving the warping points such that the distance between template and incoming beat is minimized. The optimally fitted template and corresponding warping points are shown in red.
The algorithm was proved to measure QT variability with high precision and is robust to common ECG artefacts [1, 2, 3].
[1] Schmidt M, Baumert M, Porta A, Malberg H, Zaunseder S. Two-dimensional warping for one-dimensional signals - Conceptual Framework and Application to ECG Processing. IEEE Trans Signal Process. 2014; 62: 5577-5588.
[2] Zaunseder S, Schmidt M, Malberg H, Baumert M. Measurement of QT variability by two-dimensional warping. Cardiovascular Oscillations (ESGCO), 8th Conference of the European Study Group on, 2014: 163-164.
[3] Baumert M, Czippelova B, Ganesan A, Schmidt M, Zaunseder S, Javorka M. Entropy analysis of RR and QT interval variability during orthostatic and mental stress in healthy subjects. Entropy 2014; 16: 6384-6393.